It might sound crazy but there are holes in a good funnel chart.
If you've read
my previous article, you already know how easy it is to create a funnel chart that is wrong in many ways. And that sometimes it's better to visualize your data in a simple bar chart. However, as my colleague
Sam Boonin observes, funnel charts are very popular:
I did a survey during the "track your marketing waterfall" webinar where I asked people to vote on funnel chart vs bar chart, and they all voted for funnel.
Would you believe that? A funnel chart, which is in fact a single stacked bar chart -- the second-worst evil right after pie chart! (Read
Stephen Few if you have no idea why.)
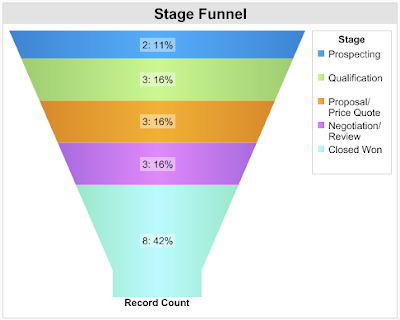
Let's look at the funnel chart we've ended with yesterday:
There are 3 opportunities in the Qualification stage, 3 in the Proposal stage, and 3 in the Negotiation stage. Do these numbers (3, 3, and 3) look like the same in the funnel? No, because the chart is funnel shaped, so it looks like the Qualification stage is bigger than Proposal, and much much bigger than Negotiation.
But wait, isn't it true that an opportunity was in the Qualification stage before it went to Proposal? That's a very important mind shift. If opportunities flow from one stage to another, it's not really important where they are today but how they were able to get there and whether they move in the future or not.
Check out the following table:
| in stage | as of today | ever |
| Prospecting | 2 | 2 + 17 = 19 |
| Qualification | 3 | 3 + 14 = 17 |
| Proposal | 3 | 3 + 11 = 14 |
| Negotiation | 3 | 3 + 8 = 11 |
| Closed Won | 8 | 8 |
If we start from the bottom, there are eight Closed Won opportunities at the end of our funnel. In Negotiation, there are three opportunities right now, but these eight won opportunities were in Negotiation, at some point in time, so the total is eleven. Fourteen opportunities were even in Proposal: three that are there right now, and eleven that were in Proposal and are in Negotiation or Closed Won. And so on, the funnel starts with 19 opportunities.
If it's simple like that in your business, you're lucky. But most of us have no sales funnel like that. We have a funnel with holes, we have a funnel combined with a colander. That's why the whole funnel metaphor is wrong -- if you pour a glass of water into a real funnel, you get a glass of water coming out of it. If you pour a thousand leads into a sales funnel, you don't get a thousand won deals.
In our example, there are eight opportunities won but also ten opportunities lost and 2 opportunities deferred. And unfortunately, we're not able to fix the table, because we're not sure at what stage was an opportunity moved to Closed Lost. Was it after Negotiation or immediately after Prospecting?
To understand that better, we need to look at opportunities history. To make a good and correct funnel chart, we need to switch from Salesforce.com to GoodData.
Don't take me wrong, you can create a very wrong funnel chart in GoodData, too. Look at this one, created in the Sales Analytics Demo project:
The two Closed stages are so big that the real funnel is almost invisible. So let's fix it, i.e. let's introduce holes into the funnel.
In GoodData, Salesforce.com data are stored in snapshots. You can look at your numbers as of today but you can also look at history: how was my pipeline two months ago, in the beginning of quarter etc. In this case, we will look at all the snapshots at once and ask a simple question: How many opportunities were ever in these stages?
We need to create a metric to answer such a question. This is the first one. It counts all opportunities that were ever in our funnel:
The next one starts with the second stage:
I guess you already know why we include all the stages. Let's explain it on the third metric:
One would say that to get the number of opportunities that were ever in stage Cultivate, it's enough to include this stage in the metric definition, and skip the tail of the funnel. That is true in an optimal world where opportunities are not beasts and sales reps are not lazy to track everything.
For example, there might be an opportunity that was won without entering the Cultivate stage. Or maybe it was in fact in Cultivate but nobody has changed the stage in Salesforce.com. Maybe it skipped Cultivate and went immediately to Proposal. In all these cases, we want to count this opportunity to the Cultivate stage of our funnel, because it would be there in the optimal world.
What is the difference between the first and the third metric? Here we have the holes. The third metric doesn't count the opportunities that left the funnel in the first two stages. If an opportunity was in Prospect and then closed as Lost, it's not there. If it was in Prospect, and then Qualify, and then Lost, it's not there.
Stage is a checking point, and you measure how many opportunities were able to get there. That's what a funnel is for and what a funnel chart should visualize.
I guess you can imagine how the other four metrics look like. Drum roll, here's a good funnel chart.
It's a holistic overview of your historical pipeline, your successes, and -- your holes. 4,192 opportunities are at the top of the funnel, and because it's part-funnel, part-colander, only 2,893 of them are at the bottom. As you go down, the numbers are getting thiner and thiner. The shape of the chart is not funny anymore, it has a meaning.
So now you have your funnel chart. Time to get these holes fixed.